Zalo
Zalo|
Nano Copper (CP2CO – ACM) |
|
| Size | Nano |
| Exchange | Asia Commodity Marketplace (ACM) |
| Commodity code | CP2CO |
| Contract lot value (market price) | Commodity price * contract size |
| Contract size | 1,000 pounds |
| Margin (changes according to MXV) | 0.0005 ~ $0.5/lot |
| Trading price step | usd/pound |
| Quoted unit | $1,000 |
| Profit/loss fluctuation $1/lot | 04 consecutive contract months |
| Trading period | Monday – Friday |
| Trading schedule | 05:00 – 04:00 (the next day) |
| Trading session (winter opens 60 minutes late) | Level 1: 9%; Level 2: 13%; Level 3: 20% |
| Price range | According to ACM regulations |
| Quality standard | According to MXV regulations |
| Delivery Registration Date | According to MXV regulations |
| First notice day | According to MXV regulations |
| Last trading day | No physical delivery |
| Payment method | Asia Commodity Marketplace ( ACM ) |
I. Product Overview
1. Characteristics
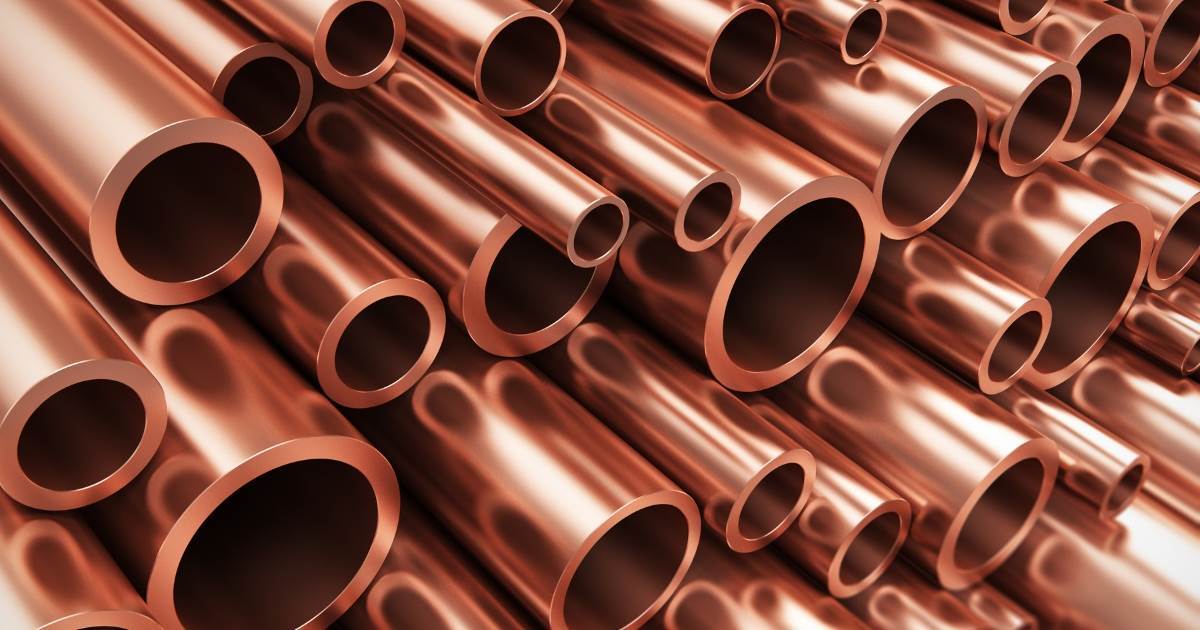
Copper (Cu) is a highly ductile metal with excellent electrical and thermal conductivity, making it one of the most widely used metals on Earth.
Pure copper is soft and malleable, with a bright reddish-orange surface. It is commonly used in electrical and thermal conduction, construction materials, and as a component in various metal alloys.
Unlike gold or silver, copper is generally not considered a store of value, which keeps its price significantly lower than precious metals. Global copper supply consists of primary mined ore and recycled copper, with recycled copper accounting for approximately 30% of annual demand.
2. Applications
Machinery and Equipment: Copper alloys are used for producing gears, shafts, and turbine blades due to their strength, ductility, and precision casting properties.
Consumer Products: Copper’s strong antimicrobial properties make it suitable for cookware, handrails, and door handles.
Electronics: Integrated circuits and printed circuit boards often utilize copper for its high electrical conductivity.
Construction: Copper is used in wiring systems and weather-resistant plumbing.
Transportation: Copper is integral in electric motors due to its conductive properties.
3. Trading Advantages
High Liquidity: Copper has strong trading volume across multiple timeframes, offering numerous investment opportunities.
Leverage: High leverage ratios enhance purchasing power and control over nominal value.
Price Hedging & Risk Management: Manufacturers use copper trading for hedging purposes, while global funds trade on trend-following strategies, reflecting the market’s scale and resistance to price manipulation.
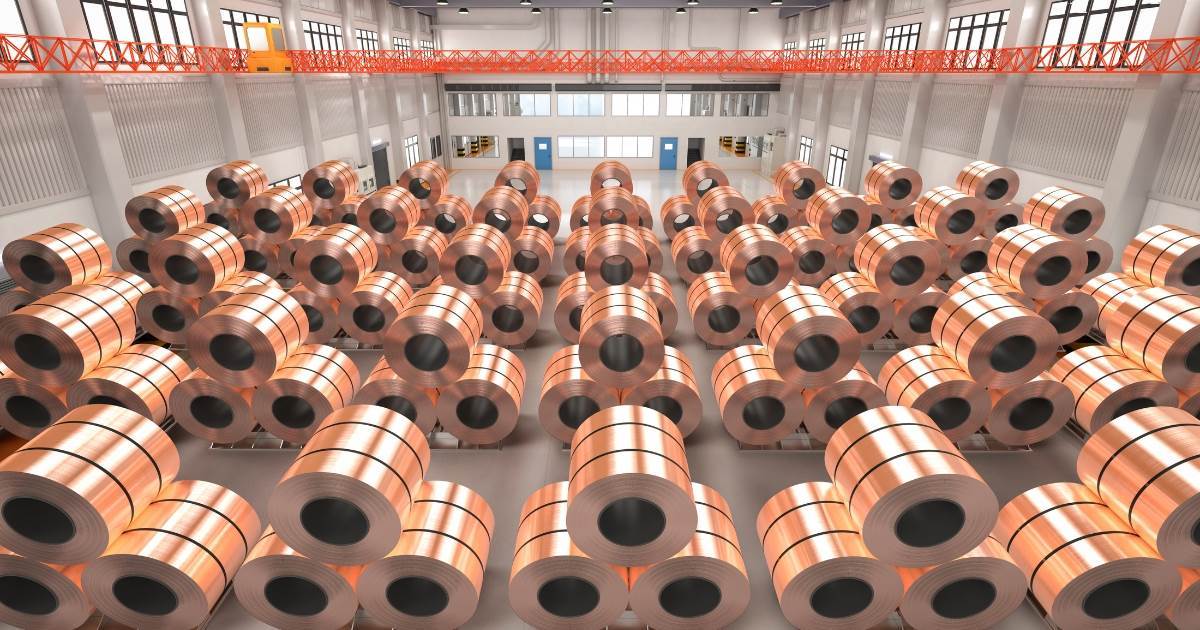
4. Production
Global copper supply is dominated by countries with significant reserves, including Chile, Peru, DRC, China, USA, and Indonesia. While some countries have large reserves, certain regions export only raw copper and import processed copper products to meet domestic demand.
Leading copper ore producers:
- Chile: The largest global producer, contributing over 28% of total mined copper.
- Peru, DRC (Congo), China, USA, Indonesia are also major produce
Global mined copper totals approximately 22–23 million tons annually, while refined copper production reaches 25–27 million tons, factoring in recycled material.
Copper production is not solely dependent on the extraction of new minerals — recycled copper provides approximately 30% of the raw materials for manufacturing new products. Recycled copper reduces supply pressure and production costs.
5. Consumption
China is the largest copper consumer globally, accounting for ~60% of refined copper consumption in recent years.
Other key regions include Europe, North America, and Asia outside China.
Copper demand, driven by construction, electronics, and industrial production, is often used as an indicator of global economic health.
II. Factors Affecting Copper Prices
Copper prices are determined by global supply-demand balance and influenced by market dynamics, macroeconomic factors, and technical considerations.
1. Economic Growth:
Copper demand is closely tied to industrial activity. Strong economic growth in sectors like construction and manufacturing typically supports higher copper prices.
Copper demand is closely tied to industrial activity. Strong economic growth in sectors like construction and manufacturing typically supports higher copper prices.
2. Consumption Trends:
China and the USA are the two largest consumers of copper. Copper prices are particularly correlated with Chinese stock market trends, making economic signals and construction demand in these regions crucial for pricing.
Emerging markets also affect copper demand via industrial expansion and factory investments.
3. Exports
Chile, as the world’s largest copper producer, exports mainly to China, the top consumer.
Changes in Chilean exports serve as a proxy for Chinese copper demand; higher exports generally support copper prices.
4. Copper Supply
Political, environmental, and labor issues can significantly impact prices.
South America (Chile, Peru) accounts for a substantial share of supply. Nationalization events (e.g., Bolivia 2007) or strikes can disrupt supply, pushing prices higher. Natural disasters (earthquakes, landslides) may delay mining operations, creating upward price pressure.
Natural disasters (earthquakes, landslides) may delay mining operations, creating upward price pressure.
For these reasons, investors should pay attention to geopolitical news and natural disasters affecting the mining industry, especially in South America (Chile and Peru).
5. Inventory Levels
Copper inventories indicate supply-demand balance.
Rising inventories suggest weaker demand, exerting downward pressure on prices.
Falling inventories indicate stronger demand, supporting prices.
LME, COMEX, and SHFE stock levels reflect short-term supply-demand conditions: rising stocks often depress prices, while declining stocks drive them higher.
6. Seasonal Trends
Copper prices often rise during December–February as Chinese companies stockpile ahead of the construction season and July–August, coinciding with peak automotive production.
7. Correlation with Oil Prices
Copper refining is energy-intensive, with energy costs accounting for ~30% of total mining and processing costs. Higher oil prices increase production costs, leading to higher copper prices.
8. Impact of Technology & Renewable Energy
Electrification, EV adoption, renewable energy, and AI/data centers are expected to sustain long-term copper demand, contributing to potential future supply deficits.
III. Advantages of Trading Copper
When trading on exchanges like the LME or in the derivatives market:
- High Liquidity: Copper is among the most actively traded base metals on major exchanges.
- Hedging Tools: Futures and options allow producers and consumers to manage price risk.
- Significant Volatility: Provides numerous opportunities for short-term and long-term investors.
IV. Copper Trading Strategies
1. Based on Macroeconomic Data
Copper prices reflect economic health. Investors monitor GDP, PMI, industrial production, housing sales, particularly in China and the USA. Positive indicators generally support higher prices.
 2. Market Trends
Stock market trends reflect investor expectations for economic growth. Copper prices are closely correlated with Chinese and US equity markets. Investors may buy copper during bullish market phases and sell during downturns.
3. Inventory Data
Copper prices often move inversely to inventory levels. LME-certified daily stock reports provide key signals for trading decisions.
4. Commitment of Traders (COT) Reports
COT reports indicate market participant positions, especially funds’ net positions. Overbought conditions often trigger profit-taking and price drops, while net short positions can drive prices higher.
5. Correlation with Crude Oil Prices
Copper prices are highly correlated with oil prices due to energy-intensive refining. Rising oil prices may signal buying opportunities in copper, while falling oil prices may indicate downward pressure.