Zalo
Zalo|
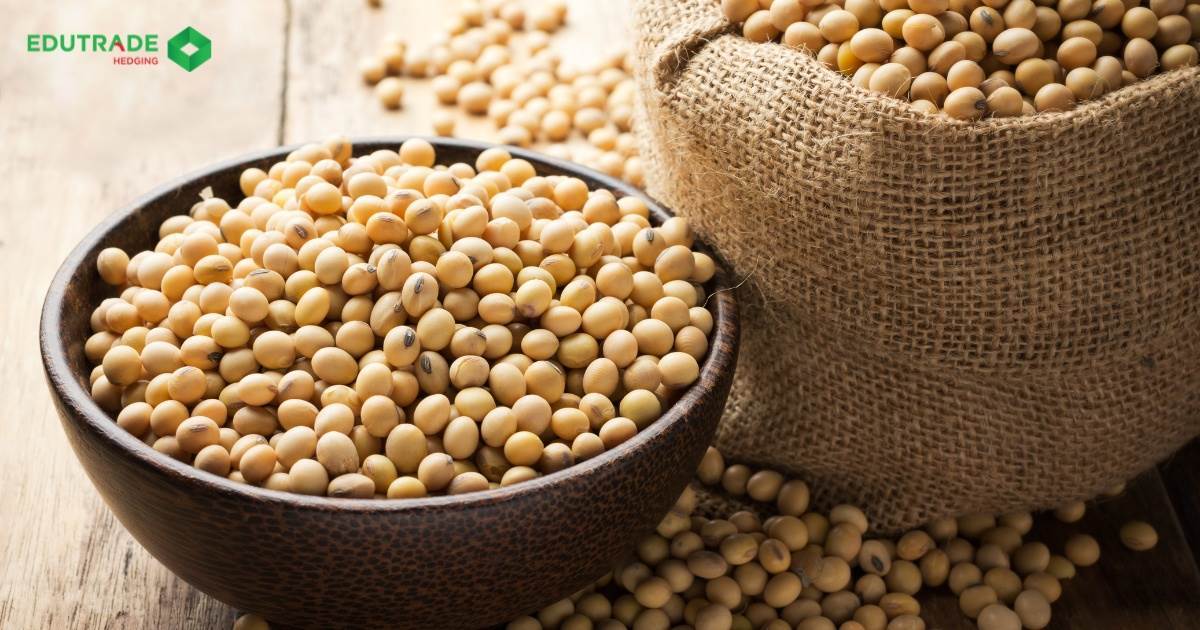
Soybeans ( ZSE – CBOT ) |
|||
| Size | Full | Mini | Micro |
| Exchange | CBOT (Chicago Board of Trade ) | CBOT (Chicago Board of Trade ) | CBOT (Chicago Board of Trade ) |
| Commodity code | ZSE | XB | MZS |
| Contract lot value | Commodity price * contract size | Commodity price * contract size | Commodity price * contract size |
| Contract size | 5,000 bushels ~ 100 tons | 1,000 bushels ~ 20 tons | 500 bushels/lot ~ 10 tons |
| Margin (changes according to MXV) | 10% of contract lot value | 10% of contract lot value | 10% of contract lot value |
| Trading price step | 0.25 ~ $12.5/lot | 0.125 ~ $1.25/lot | 0.5~ $2.5/lot |
| Quoted unit | cents/bushel | cents/bushel | cents/bushel |
| Profit/loss fluctuation 1/lot | $50 | $10 | $5 |
| Trading month | 1;3;5;7;8;9;11 | 1;3;5;7;8;9;11 | 1;3;5;7;8;9;11 |
| Trading hours | Monday – Friday | Monday – Friday | Monday – Friday |
| Trading session
(winter opens 60 minutes late) |
07:00 – 19:45
20:30 – 01:20 (next day) |
07:00 – 19:45
20:30 – 01:20 (next day) |
07:00 – 19:45
20:30 – 01:20 (next day) |
| Price range | Initial price limit: $0.35/bushel
Expanded price limit: $0.55/bushel |
Initial price limit: $0.35/bushel
Expanded price limit: $0.55/bushel |
Initial price limit: $0.70/bushel
Expanded price limit: $1.05/bushel |
| Quality standard | Soybeans type 1, type 2, type 3 | Soybeans type 1, type 2, type 3 | Soybeans type 1, type 2, type 3 |
| Delivery Registration Date | 5th working day, before the
first notice |
5th working day, before the
first notice |
According to MXV regulations |
| First notice day | Last working day of
month immediately preceding the expiration month |
Last working day of
month immediately preceding the expiration month |
Last working day of
month immediately preceding the expiration month |
| Last trading day | Working day 15 days prior
of the expiration month |
Working day 15 days prior
of the expiration month |
6th working day, before the
first notice |
| Payment method | Physical delivery | Physical delivery | No physical delivery |
I. Product Overview
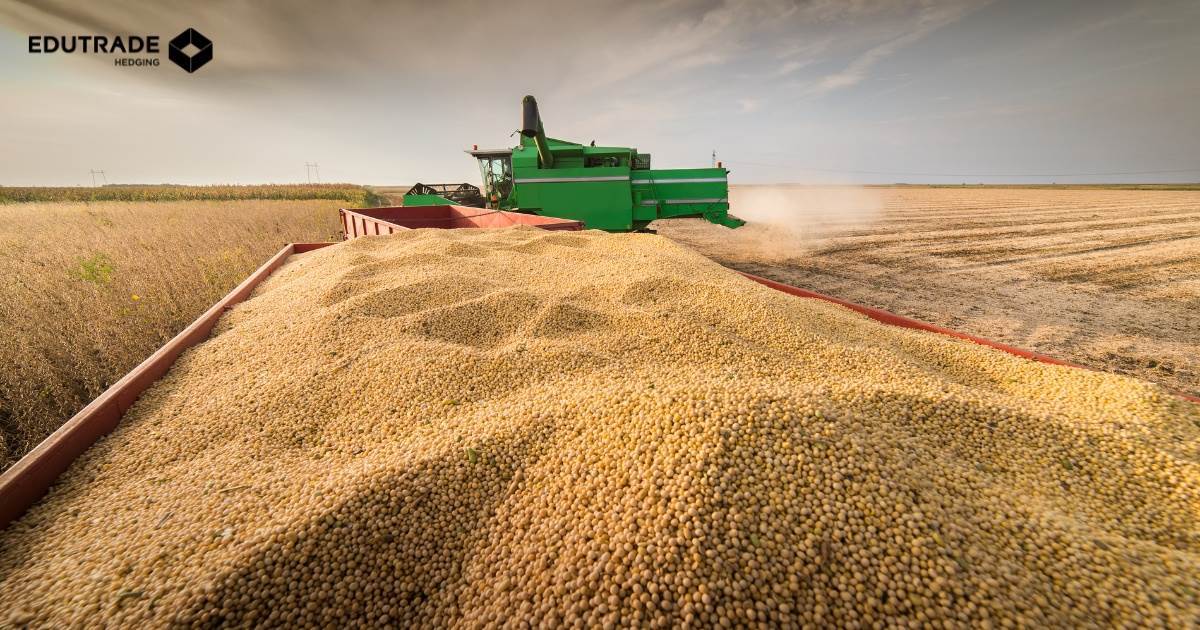
1. Origin
- Soybean (Glycine max) belongs to the Fabaceae family, originating from East Asia and now widely cultivated worldwide.
- Currently, Brazil, the United States, and Argentina are the three major producers, accounting for the majority of global output (Brazil leads with an estimated 164 million tons in the 2024/2025 crop year).
- One bushel of soybeans (60 pounds, ~27.22 kg) produces approximately 11 pounds of oil and 48 pounds of protein-rich meal
2. Uses
Soybean is an economically efficient and easy-to-cultivate crop. Its products are highly versatile, including raw beans, tofu, soybean oil, soy sauce, confectionery, soy milk, and more, meeting protein requirements for both humans and livestock.
Primary Uses:
- Animal Feed: Soybean meal accounts for the majority of usage in animal husbandry (around 80%).
- Soybean Oil: Average oil content of 18–20%, primarily for human consumption.
- Processed Products: Tofu, soy milk, soy sauce, confectionery, and other protein-based products.
- Industrial Applications: Used as a raw material for biofuel production, especially biodiesel.
Soybean meal constitutes approximately 78–80% of soybean crushing output and remains the primary protein source in animal feed.
- About 97–98% of soybean meal is used in livestock and aquaculture feed, while the remaining 2–3% is utilized in protein alternative foods or soy milk products.
Soybean oil accounts for 18–20% of crushing output. According to USDA and Reuters (2025–26), over 50% of U.S. soybean oil is used for biofuel production (biodiesel/renewable diesel), marking a record high. The remainder is used for food and other industrial purposes, including cooking oil, cosmetics, and food processing.
- Vietnam is expanding ethanol production for E10/E100 blending; however, current domestic capacity meets only 25–32% of demand, with the remainder requiring imports or production expansion.
3. Seasonal Soybean Prices
- Soybeans are primarily harvested in the Northern Hemisphere fall (September–October), often causing prices to hit seasonal lows during this period.
- Prices may gradually increase toward the end of the crop year (May–July) due to consumption demand and reduced inventories before the new harvest.
4. Major Soybean Producers
Brazil, the United States, and Argentina are the three main producers, accounting for 81% of global exports. Seasonal developments in these countries are key drivers of price fluctuations.
- Brazil: The world’s largest producer and exporter, with projected record output of approximately 169–177 million tons in 2025.
- United States: Approximately 117 million tons (2024/25), with stable projected production in 2025.
- Argentina: Around 49–51 million tons, continuing as a major supplier.
Regional Characteristics
- Unlike the Northern Hemisphere, the Southern Hemisphere (Brazil, Argentina) harvests in spring–summer, allowing year-round supply distribution
- Brazil is expected to dominate exports to China in 2025, surpassing the U.S. due to trade tensions and price competition.
II. Key Factors Affecting Soybean Prices
1. Nature & Weather
Weather and natural disasters affect yields, thereby influencing supply. Unless conditions are favorable for cultivation and product development, extreme sunlight, drought, humidity, heat, or cold will negatively impact agricultural output.
- Adverse weather in the U.S. Midwest or South America can reduce production, impacting prices.
- Conversely, favorable seasons may increase supply and exert downward pressure on prices.
2. U.S. Dollar
Soybeans are priced in U.S. dollars
A strong dollar makes dollar-denominated commodities more expensive relative to other currencies, negatively affecting demand for U.S. soybeans.
Conversely, a weaker dollar makes these commodities cheaper and more competitive, increasing demand and prices, while potentially reducing incentives for producers to increase output.
3. Trade Policies & Tariffs
As a major agricultural commodity exported worldwide, trade agreements and tariff policies impact each country’s import/export demand.
Trade negotiations (e.g., U.S.–China) can influence soybean trade flows. For instance, in 2018, China raised import tariffs on U.S. soybeans, which increased U.S. soybean prices in China and reduced import demand.
In 2025, tariff measures continue to shift Chinese import priorities toward Brazil and Argentina.
4. Demand from China
As the world’s largest soybean importer, China’s demand heavily affects global soybean prices.
From 1986 to 2012, China’s meat production increased by 250%. Domestic feed production is insufficient, making soybean imports essential.
5. Energy Prices
Energy costs constitute a significant portion of operational expenses for most crops. Higher energy prices increase soybean production and transportation costs, thereby raising soybean prices.
6. Stock Levels
- Inventories act as a “buffer” for both producers and consumers. Declining stocks occur when demand grows faster than supply, leading to higher prices. However, low inventories make the market more vulnerable to unexpected supply disruptions or demand spikes.
- The global soybean supply chain enters mid-year with record harvests, historically high stocks, and diverse regional trade patterns. End-of-2024/25 global stocks are expected to reach 123.2 million tons, up 6.8% year-on-year, with China holding 43.9 million tons, or 36% of the total. (Source: Global Soybean Market – June 2025)
7. Key Market Reports
- Export Reports
- Export Inspections Reports
- Supply & Demand Reports
- Crop Progress Reports
- Commitment of Traders (COT) Reports
- Energy Production Reports (EIA)
III. Key Strategies for Effective CBOT Soybean Oil Investment
In-depth product knowledge:
- Understand product characteristics: Familiarize with soybean oil specifications (crude, refined, moisture content, impurities), production process, CBOT trading standards, storage, and transportation requirements.
- Market analysis: Study global supply-demand dynamics, price trends, and influencing factors such as production, stock levels, and trade/tariff policies.
Monitor Price Movements & Market Data:
- Continuously track soybean oil prices on CBOT, as well as information on production, stocks, imports/exports, and substitute markets (palm oil, soybean oil derivatives, biodiesel).
Technical & Fundamental Analysis:
- Use technical analysis tools to identify price trends and critical support/resistance levels.
- Combine with fundamental analysis using WASDE reports, NOPA Crush reports, Chinese import and crushing data, weather conditions, and tariff policies.
Consult Experts & Enhance Knowledge via Edu Trade:
- Learn about Edu Trade: A reputable derivatives investment firm providing knowledge and tools for effective trading.
- Participate in investment courses: In-depth courses on derivatives equip investors with market analysis, trend forecasting, and informed decision-making skills.
- Expert consultation: Experienced professionals are available to support, answer inquiries, and offer guidance aligned with investment strategies.
The above insights are provided by Edu Trade regarding CBOT soybean products.
For those interested in participating in the derivatives market, please contact Edu Trade via Hotline: 0866.212.677 for detailed consultation.
Edu Trade – Leading member of the Vietnam Commodity Exchange.